An in-depth Analysis of the Iris Dataset

The Iris flower data set is a multivariate data set introduced by the British statistician and biologist Ronald Fisher in his paper published in 1936. The data set consists of 50 samples from each of the three species of Iris as shown above in the picture. Four Features were measured from each sample – the length and width of the sepals and petals in centimeters.

Lets dive into the analysis using python version 3 !

Importing necessary libraries

import pandas as pd
import numpy as np
import seaborn as sns
import matplotlib.pyplot as plt

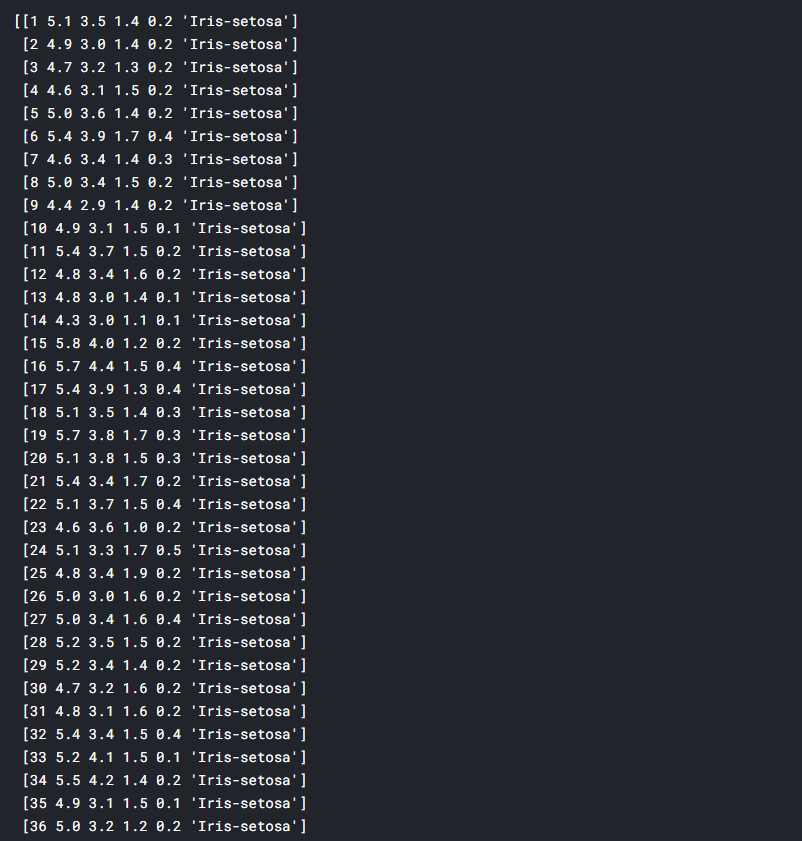
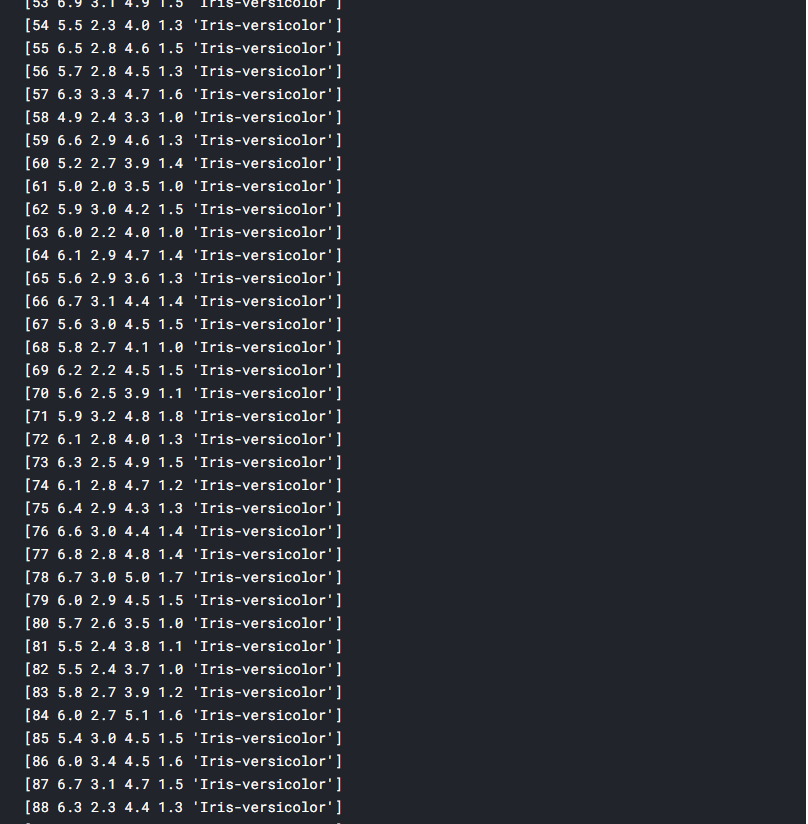
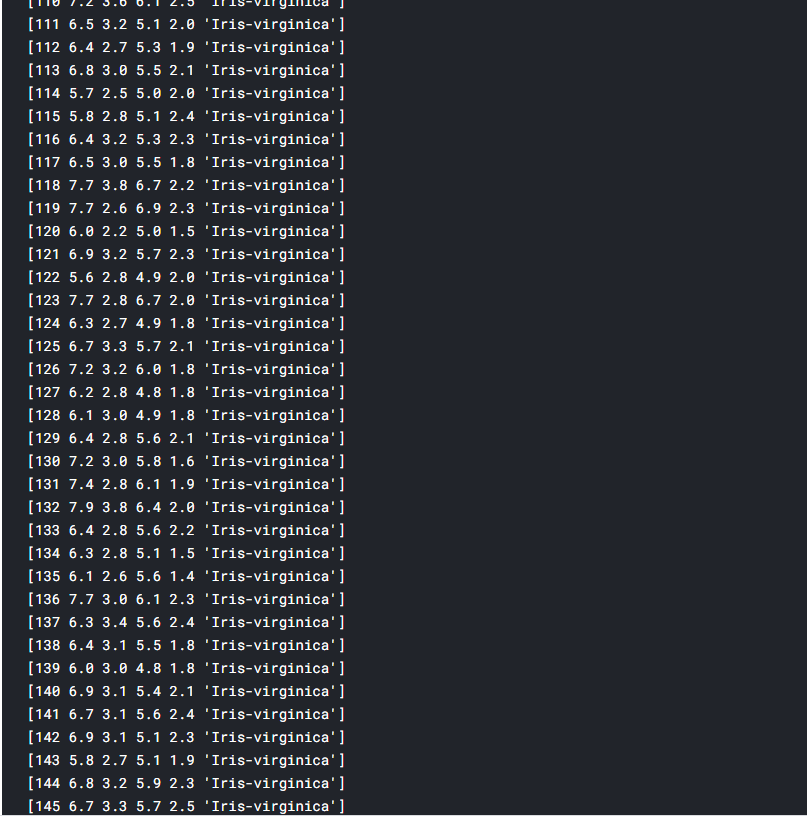
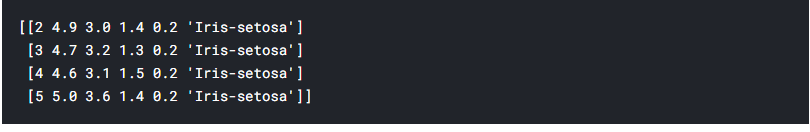
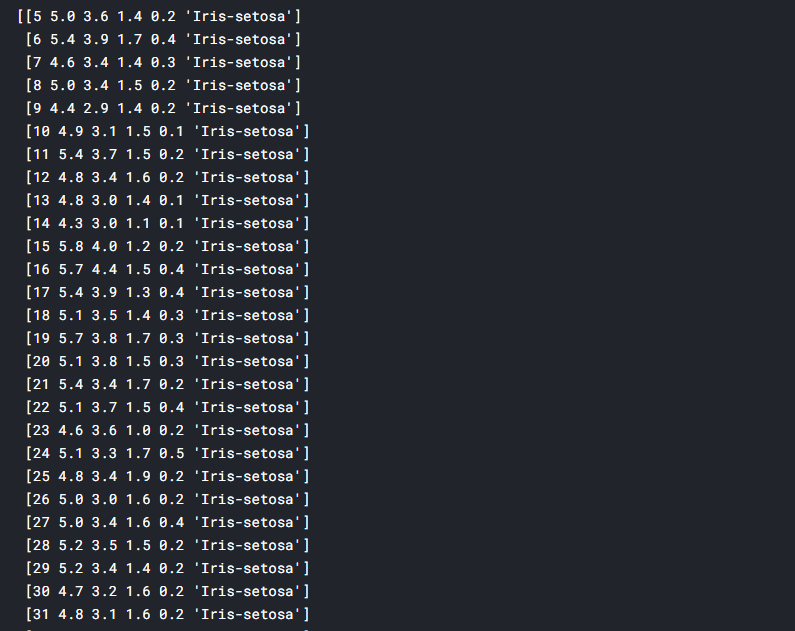
NumPy is a Python library used for working with arrays. It also has functions for working in domain of linear algebra, fourier transform, and matrices. NumPy was created in 2005 by Travis Oliphant. It is an open source project and you can use it freely. NumPy stands for Numerical Python.

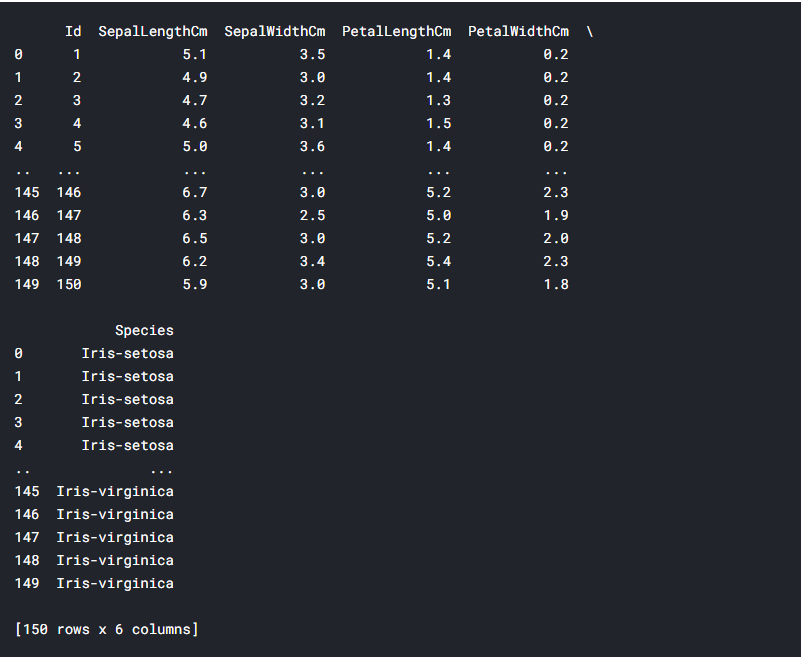
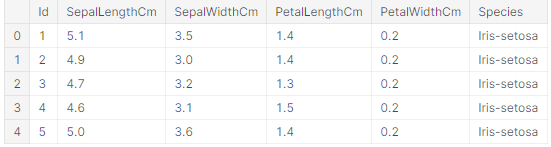
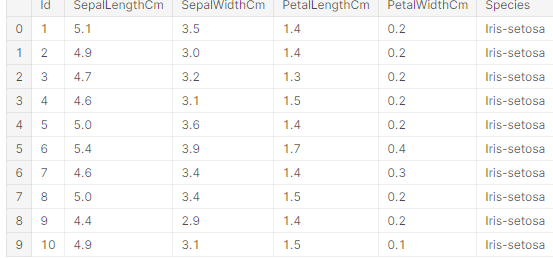
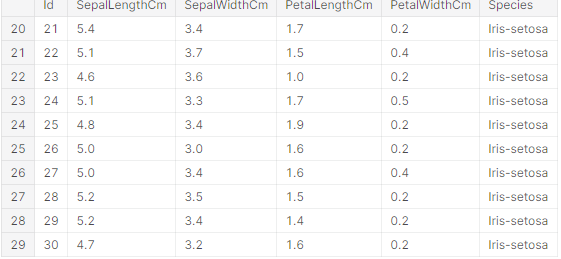
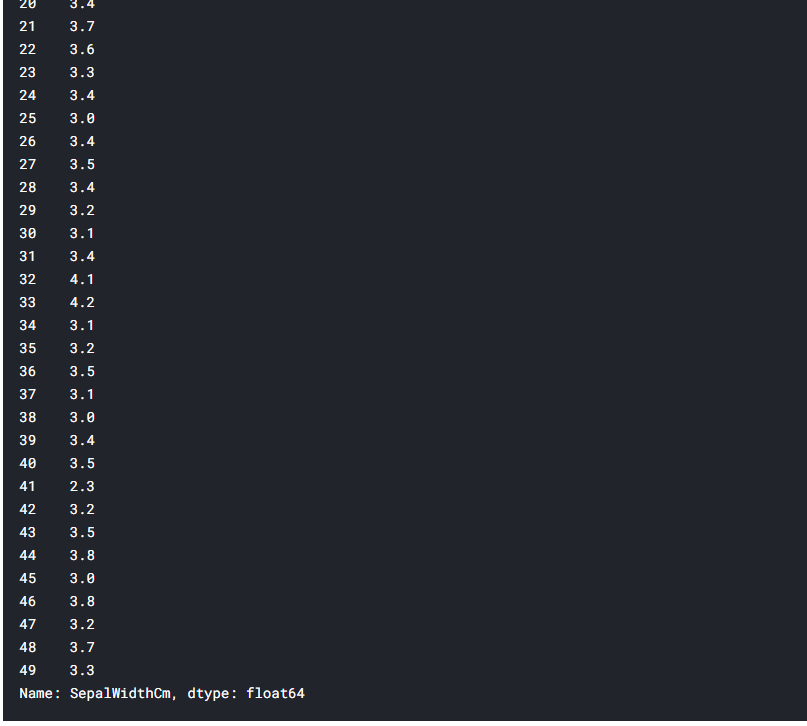
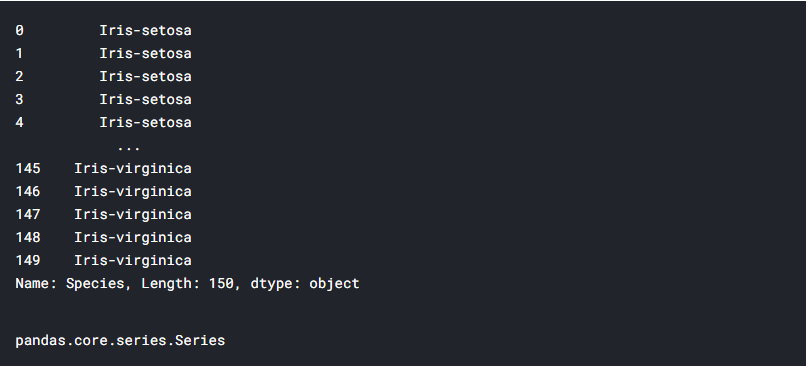
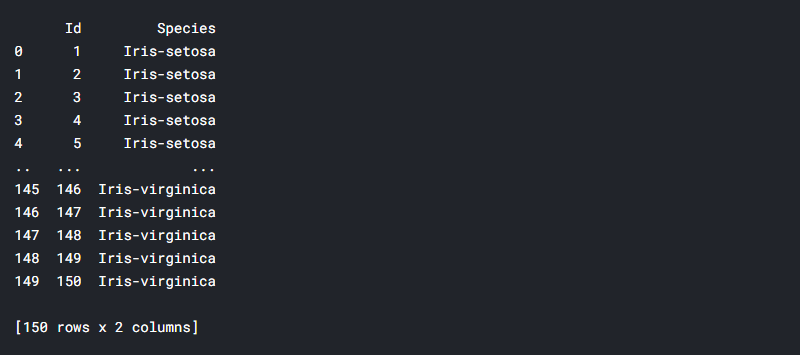
Pandas is a software library written for the Python programming language for data manipulation and analysis. In particular, it offers data structures and operations for manipulating numerical tables and time series. The package is known for a very useful data structure called the pandas DataFrame. Pandas also allows Python developers to easily deal with tabular data (like spreadsheets) within a Python script.

Loading the data

#reads tabular data and gives in tabular form
iris = pd.read_csv("../input/iris/Iris.csv")
#iris=pd.read_excel("")
print(iris)

Exploratory Data Analysis

Exploratory data analysis (EDA) is used by data scientists to analyze and investigate data sets and summarize their main characteristics, often employing data visualization methods. It helps determine how best to manipulate data sources to get the answers you need, making it easier for data scientists to discover patterns, spot anomalies, test a hypothesis, or check assumptions.

EDA is primarily used to see what data can reveal beyond the formal modeling or hypothesis testing task and provides a provides a better understanding of data set variables and the relationships between them. It can also help determine if the statistical techniques you are considering for data analysis are appropriate. Originally developed by American mathematician John Tukey in the 1970s, EDA techniques continue to be a widely used method in the data discovery process today.

We will now explore the data to find useful information and insights from the data which will help us to prepare our machine learning model. Let us explore the data set at first using numpy library.

arr = np.array(iris)

print(arr)

The above output shows the whole data set up to 150 samples but it was shown partially in the image.

#This code prints all the rows starting from the 5th row

print(arr[4:])

To know more about numpy you can also watch my video tutorials in youtube.

Let’s see some data analysis using pandas.

#This code prints the first five rows in the data set in tabular form
iris.head()
iris.head(10)
iris[20:30]

Now we will select some subset from the dataframe

species= iris["Species"]
print(species)
type(species)

#only specific columns are accessed

id_species = iris[[“Id”, “Species”]]

print(id_species)
id_species.head(15)
iris.SepalWidthCm.mean()
max(iris.SepalWidthCm)
iris.loc[iris['SepalLengthCm'] > 6]
#chooses all the species with sepal length greater than 6
iris.loc[iris['SepalLengthCm'] > 6, ['Species']]

Data Visualization

We will know plot some graphs to get some insights from the data uding seaborn.

#This is a multivariate plot
sns.pairplot(iris.drop("Id", axis=1), hue="Species", size=3)

Decision Tree Classifier

Decision Trees (DTs) are a non-parametric supervised learning method used for classification and regression. The goal is to create a model that predicts the value of a target variable by learning simple decision rules inferred from the data features.

I hope you enjoyed this simple tutorial. Keep an eye on my website for more tutorials like this!